
I wrote this piece for a Wolfram technology blog a while back. It’s a bit Mathematica centric for that reason. The blog got delayed, then the editor left the company, then the new editor blew off the piece and I got tired of waiting, so here it is.
Not so long ago…
In 2012, the Raspberry Pi Foundation released the Raspberry pi, an affordable, credit-card sized computer originally designed to help younger students learn programming. It peels away the black-box of computers and exposes users to the fascinating world of how software controls hardware that control sensors that interact with the user’s surroundings. The computer science community refers to this idea as physical computing. As an Analytical Chemist, I call it a scientific instrument. Since much of my research and teaching deals with scientific instrumentation, the Raspberry Pi has turned out to be an excellent platform for exploring new ways to make measurements.
In 2013, Wolfram announced that Mathematica would be available on the Raspberry Pi. At the time, I was already working through a Adafruit’s tutorials on how to blink lights, read sensors and display information on attached LCD screens with the goal of using the Raspberry Pi as a platform for integrating physical computing into Chemistry education. Having been a Mathematica user since version 5.2, I was immediately excited about the opportunities of having the software package on an accessible hardware platform.
One area of Chemistry education (or STEM education in general) that particularly interests me is how different learning modalities can be used to assist students in attaining their educational goals. It is becoming increasingly apparent that the concept of learning styles is not supported by evidence-based research; however, it is not clear to what extent curriculum development that integrates multiple learning modalities (Visual, Auditory, Tactile and Kinaesthetic) facilitate cognition. That is a fancy way of saying that I want to build Chemistry-themed educational tools and see how they help people learn.
An idea was hatched…
With access to a small, cheap computer and digital fabrication tools, I reflected on projects to tackle, I wanted to explore how to design a periodic table that would encourage users to spend more time looking at it and interacting with it. Inspired in part by a CNCed world map fitted with over 400 RGB LEDs, I thought a Periodic Table – which would only require 118 LEDs – would be a very approachable project. Since I subscribe to the philosophy that we should add one more thing to projects in order to make them our own, I figured that an LED Periodic Table project required a little more than blinky lights to differentiate it from the blinky light world map. I decided to incorporate a speech-recognition engine into the design, which would allow viewers to decide which periodic trend was displayed. With that, the idea for Mandy – the bright interactive periodic table was born.
With Wolfram in the Workflow…
The Mandy project was broken into three phases: design, data and deployment, and took about 4 months to complete. Mathematica was incorporated into each stage of the project, as shown in the block diagram below, and in this section I would like to highlight several areas where the software package greatly facilitated development.

Workflow for developing Mandy.
Design
One of the first uses of Mathematica in the design phase was to estimate the amount of power needed to run the project. I needed 118 RGB LEDs, which each can draw a maximum of 60 mA. Not including the Raspberry Pi or other electronic components, the LEDs alone can draw in excess of 6 A of current. However, that assumes that all LEDs would just display white all the time, so the real current draw would be lower, but by how much?
With a few lines of code, I was able to estimate the current draw for a variety of color schemes. In the code block below, the first line makes use of a curated dataset, ElementData and rescales the size of atoms (deleting those that are not yet known) from 0 to 1. The second line loops through all of the standard color gradients, converts these colors into triples of red-green-blue values. Since these triplets scale from 0 to 1, they can be viewed as fractions of the maximum current applied to an LED. Summing these values gives a total current for lighting the periodic table with the chosen color gradient.
led = Cases[Table[QuantityMagnitude@ElementData[i, "AtomicRadius"], {i, 118}], _Real] // Rescale;
current = Map[{#, Round[0.001 Function[x, Total[18 (ColorData[#][x] /. RGBColor -> List)]] /@ led // Total, 0.1]} &, ColorData["Gradients"]] // SortBy[#, Last] &;
There are 51 color gradients packaged in Mathematica at this time. A selection of them shows that current predictions run from between 1.5 and 3.5 A. Add in 2 Amps for the Raspberry Pi and we find that a 10 A, 5 V power supply will certainly provide enough juice to power this project.

Predicting the amount of current used in displaying periodic trends with different color themes.
The next step in designing Mandy was to develop the front panel of the display, which consists of a laser cutout (in wood) of the Periodic Table and acrylic tiles with the symbols and atomic numbers of the elements. For this process, ElementData[] proved useful again, since the group and period of each element are provided, making it possible to create a single graphical element and then Map those elements to their appropriate locations. Laser cutters use a specific color scheme to differentiate engraving and cutting, which can by handled by using the appropriate graphics directives in Mathematica. However, in this case was more easily accomplished in graphics software.

Image for cutting (red) and engraving (black) Mandy’s (left) acrylic elements and (right) wood panel.
Data
Having access to a wealth of elemental properties through ElementData greatly facilitated the data processing steps of this project. Of the 85 properties accessible through ElementData, about half are numerical in nature and can be visualized on an LED display. Many elements do not have full complements of properties because they are not yet known, bringing the aesthetically pleasing list of LED displayable properties to about 20. Some of the properties, such as atomic weight or ionization energy, can be displayed readily after rescaling the values to lie between 0 and 1. Others require more complex transformations in order to create a visual display that emphasizes the order and magnitude of differences. The process for handling all of these transformations became a bit complex, but those who are interested can visit the Wolfram Community post which introduced Mandy or explore the full set of code, which has been posted on github. An important design consideration was that Mandy can be used without access to the internet, and therefore it was necessary to take the results from ElementData and export them as a text file. Performance was significantly improved when data could be stored in a pre-processed form as well.
Deployment
One of the early design decisions I needed to make was the hardware platform to use. I wanted to use a Raspberry Pi for access to Mathematica and speech recognition, but I had read early reports that the timing required to control the Neopixel LEDs was much more easily accomplished with a microcontroller such as an Arduino. In the end, I opted to have both pieces of hardware in the final project, and therefore needed a way to interface the two. Here Mathematica played the role of middleman by opening and controlling a serial connection between the RPi and the Arduino. At this point, things get a little clunky, because I have different platforms (Python for the speech recognition, Mathematica for the data processing and communication) as well. Visually, the system can be represented with the block diagram:

Mandy block diagram. Colors represent primary programming language: orange – Mathematica; green – C; yellow – python. PTPixels consists of pythonLink to communicate with other components on the Raspberry Pi and serial communications to connect with the Arduino.
The speech recognition component of Mandy is built upon Pocketsphinx, and a Python script that listens for valid commands and converts them into Mathematica operations. Those operations are passed to a Mathematica kernel through python-mathlink, which in turn generates the necessary information to send to the Arduino for lighting the LEDs. Some commands (which I call tricks) are stored on the Arduino itself in order to increase performance; however, the amount of data about the elements is too large to store on the Arduino, so Mathematica either sends this information from a pre-processed database or generates it on the fly. Late in the development, I learned that the LED information can be read into Mathematica, but this feature has not been incorporated into Mandy at this time.
The Table Awakens

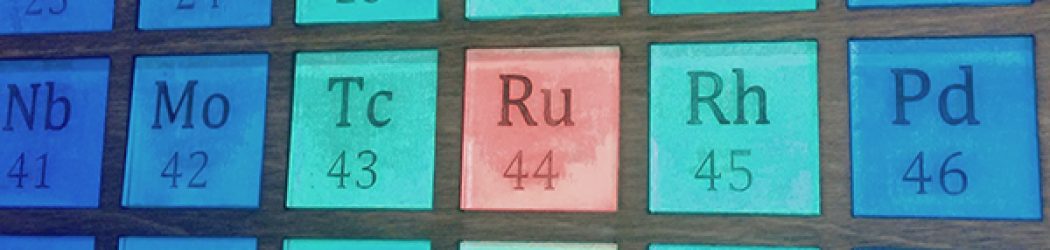
Mandy revealing one of the periodic trends
Mandy currently knows 17 periodic trends, all of which can be accessed through voice commands. Additionally, she has a feature to “tell a story” where she combines several periodic properties in order to create a new trend or tease out some of the secrets hidden within the periodic table. For example, a metallic element typically has properties such has high conductivity and melting point. When Mandy looks at these properties together, a trend different from what is typically presented in textbooks appears. As of now, these stories are static; however as the speech recognition code improves, it should be possible to have the user choose her own adventure, making Mandy a truly interactive Periodic Table experience. Here’s a video showing most of what Mandy can do. The first half of the video shows her insides.
Having access to Mathematica on the Raspberry Pi greatly facilitated the development of this project. Access to a higher-level programming platform allowed me to connect the various components of the project together; although, as is the case with the pythonLink, I had to write the connections myself. I can only hope that more robust options become available as more users request them. That said, having Mathematica as a core component of Mandy’s design opens a wide array of future opportunities. Mandy was originally designed to be independent of the internet, but that does not mean she cannot take advantage of an internet connection. I fully expect to take advantage of Mathematica’s social-media framework, allowing Mandy to share with the world all the fun facts about the Periodic Table she knows.
Pingback: Happy Birthday – From Mandy – BoBtheChemist