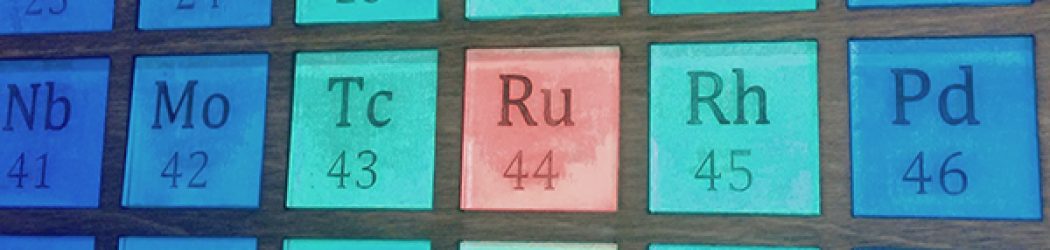

I am teaching Mandy to sing (sort of). Here’s Mandy playing along to Carol of the Bells in what may be the worlds “first” Periodic Table spectrum visualizer. Now, before we blow up the Twitter sphere with allegations that Mandy belongs on the Top Ten List of Most Infamous Lip Syncing incidents, I’m not claiming that this is live. Mandy wasn’t designed to do real-time spectrum analysis (she’s a Periodic Table, after all) but I wanted to see if some geeky visualizations would be possible. So, I created my own version of Carol of the Bells (written in Sonic-Pi) and then analyzed the audio file using Mathematica, which has a neat function, SpectrogramArray[], that provides easy access to the frequencies in an audio file. I then binned the frequencies into 118 buckets – one for each element on the periodic table, and converted the intensities into colors (blue for high amplitude, red for low amplitude). I probably should have thought a bit more about which elements should display which frequencies, but time was running short so I simply made the heavier elements have the lower frequencies. In any case – enjoy.